Designing manufacturing processes productively
What is behind the key figure OEE? And how can we improve it?
The three most important success factors in manufacturing processes are performance, availability and quality. In this blog post, you will learn how you can significantly improve in all three areas. This much in advance: The key to increasing effectiveness lies in the data already available to your company.
Taking a bird's eye view of manufacturing processes, there are three main questions whose answers determine success or failure:
- Does the throughput meet your plans?
- Can you deliver the desired quality?
- Are your assets available when you need them?
The OEE concept
When we talk about these questions, we are talking about one of the most popular KPIs in manufacturing: Overall Equipment Effectiveness (OEE), or in German, "Gesamtanlageneffektivität." Let's take a moment to look at the underlying concept. OEE is a composite KPI that consists of three components:
Availability: The net running time of a given plant compared to its planned running time. Unplanned interruptions, such as technical failures or material shortages, as well as planned stoppages, such as setup times/tool changes or daily cleaning, are taken into account. Example: 20 hours planned production time per day, 45 minutes planned maintenance and cleaning and an unplanned stop due to technical problems of 15 minutes result in an availability of 19h / 20h = 95% availability (one hour loss).
Performance: Here, everything revolves around speed. We determine the shortest theoretically achievable throughput time for a piece of finished product (= ideal cycle time) and multiply this by the number of pieces achieved during a given period. This gives us the theoretically required running time of the line. We divide this by the actual net running time during the same period and obtain a percentage value for the output. Example: With an ideal cycle time of 2 minutes, 500 parts produced, and a net run time of 18 hours, the result would be (2 x 500) / 1080 = 92.6% (1.33 hours lost).
Quality: Practically self-explanatory: We divide the number of good parts after the final inspection by the total number of parts produced and get our third percentage value. Example: 485 pieces passed the final inspection, 500 pieces were produced, therefore our quality factor is (485 pieces / 500 pieces) = 97% (15 pieces loss).
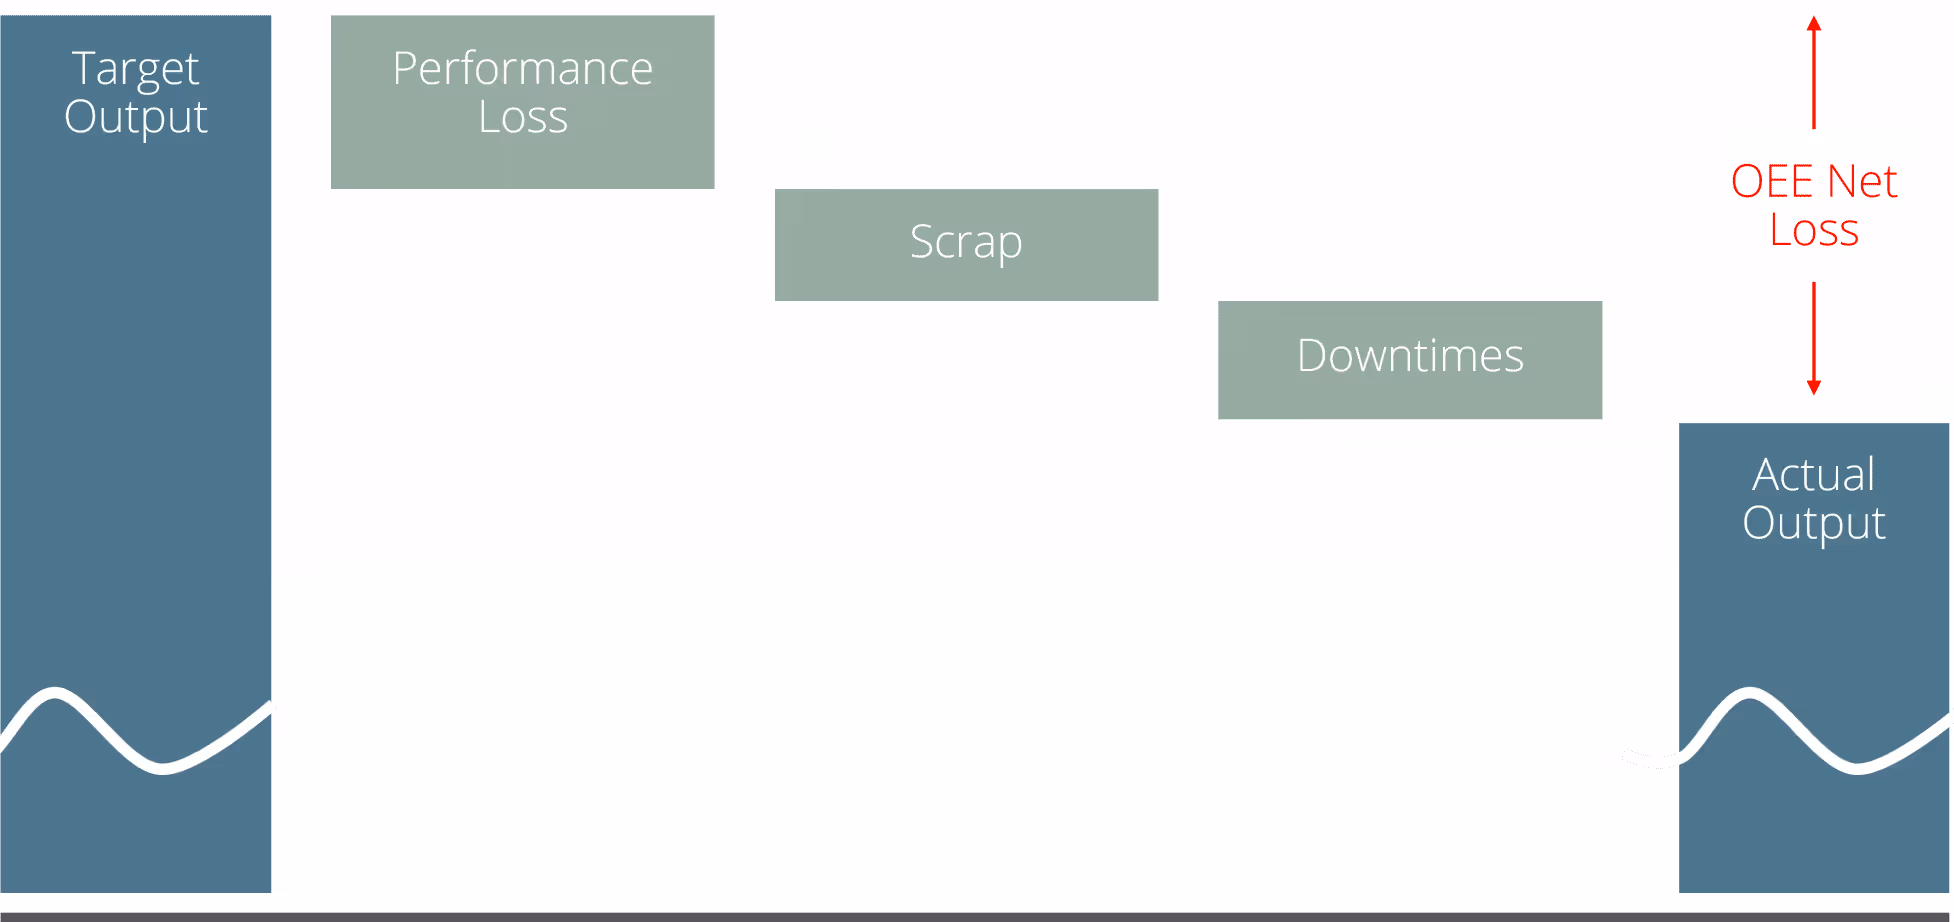
We now combine these three factors we have just determined (or loss rates, if you look at it the other way around) by multiplying them into a total value:
OEE = 95% availability x 92.6% performance x 97% quality = 85.33
The perfect score of 100% is virtually impossible to achieve. What is a good score for your business depends heavily on your industry and various environmental parameters. Therefore, benchmarking with similar companies is probably a good idea. With the 85.33% in our example, we would already be "world class" according to Seiichi Nakajima, who introduced TPM in the 1980s. So for most companies, this would already be an overly ambitious goal.

The above-mentioned OEE factors are relatively meaningless as bare figures at first. You may be able to use them to roughly estimate where you stand in an industry comparison, for example. However, taken on their own - i.e. without the process context - these values do not tell you how well you are using your potential, nor can you deduce how or where you could improve. To do this, you need to find out which parameters affect these KPIs and how you can influence them. First and foremost, this requires meaningful data and the right tools to gain insights and derive measures from them.
Four of these tools are:
- Supply Chain Analytics
- Digital Twins
- S&OP Systems
- Process Mining
New insights through supply chain analytics
I would like to summarize the basis under the term supply chain analytics . Even simple analyses of process and machine data can help improve overall plant effectiveness. New insights into the performance of your plants make it possible to identify weak points. By collecting and analyzing data on factors such as production rates, downtime and quality issues, bottlenecks and inefficiencies in your processes can be identified. This information can then be used to make adjustments to your processes, such as performing preventive maintenance or optimizing production schedules to increase OEE. In addition, supply chain analytics can be used to track the effectiveness of these adjustments over time to ensure they are having the desired effect.
Simulate impacts with Digital Twins
Adigital twin, on the other hand, is a digital representation of a physical system or process that allows the performance of the real system to be simulated and optimized in real time. It can help improve OEE by providing the ability to monitor and analyze the performance of the real system to identify and correct problems early. For example, a digital twin can be used by a production plant to collect and analyze data to optimize plant utilization, improve reliability and reduce maintenance time. A digital twin can also be used to simulate the effects ofchanges to the plant in advance to ensure that the changes have the desired effect before they are implemented in the real world.
Better coordination thanks to S&OP
S&OP(Sales and Operations Planning) is a process that aligns companies' business plans and ensures that production and material procurement are in line with sales forecasts and demand. Indirectly, this integrated planning can help improve OEE by optimally aligning production capacity with actual demand. A well-functioning S&OP system can help avoid overstocks, bottlenecks and setup times that lead to increased downtime and lower productivity. Further, it can facilitate coordination of production schedules and delivery times with clients and suppliers, which can also positively impact OEE. An S&OP system can also help optimize production processes by enabling companies to identify the impact of changes in demand and production capacity at an early stage, or to simulate and respond to them in different scenarios.
Optimize processes with process mining
If even detailed data on the individual process steps in production is available, process mining offers possibilities that go well beyond simple supply chain analyses. With process mining technology, you can analyze the digital footprint of your production. Corresponding tools use logs, i.e. log files from various source systems such as ERP, production management, machine and equipment control, etc., and translate them into a visual representation of your process. Provided that the source systems are interconnected or at least share some common data such as order numbers, you can even include adjacent processes such as sales order management or (internal) logistics to explain, for example, outliers of the availability factor of your OEE. The visualization and analysis of the actual processes in your manufacturing thus provides the content to the bare numbers and thus not only helps with their interpretation, but also directly shows those process steps or sequences that are likely to cause problems.
Conclusion
In summary, the key to improving OEE lies primarily in transparency. In addition to different types of data visualization, the ability to accurately simulate scenarios and to plan in a comprehensible and coordinated manner are the most important success factors.
Modern solutions for SCM analytics and S&OP or digital twins pave the way for this. The use of process mining can also help to quickly identify critical process flows or bottlenecks and optimize them in terms of OEE.

Blog post author

Gerrit Kohrs is Principal SCM at celver AG. He is a certified PRINCE2® Practitioner, Board Consultant and has been working in the Business Intelligence and CPM environment since 2008, initially in-house and since 2013 as a consultant and project manager. He currently advises clients from various industries on process optimization, integrated planning solutions and information design.


